Skip to work
All work
  • Cybersecurity
  • Observability

Cortex Data Lake: firewall logs in one place

A ground-up redesign of the firewall log monitoring platform Palo Alto Networks admins depend on, now shipped as Strata Logging Service.

Role
Lead Product Designer
Team
Cross-functional: PM, engineering lead, sales engineers, QA
Duration
Feb 2020 – Aug 2021
Platform
Web
Year
2021

The problem

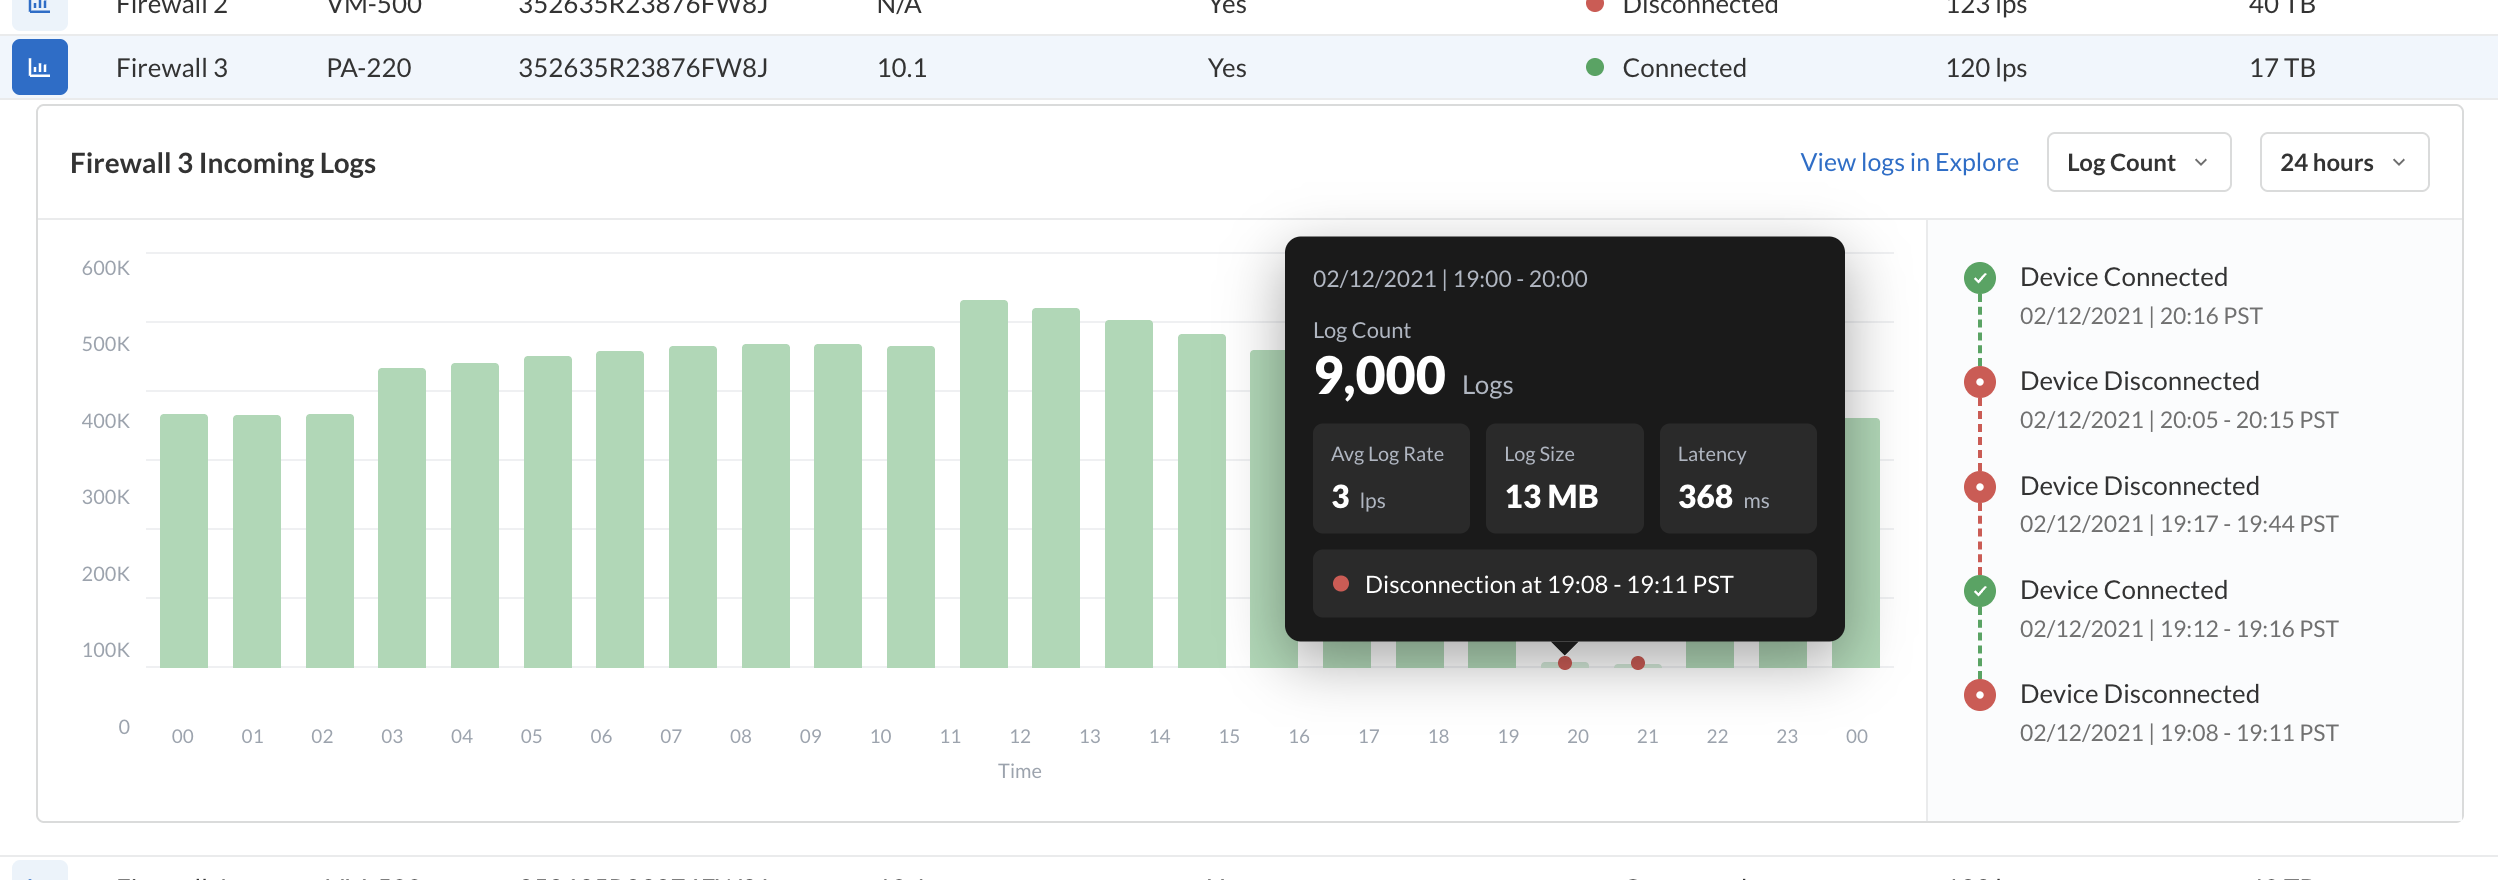
Metrics, device status, and onboarding lived in three separate apps, so finding why a firewall stopped sending logs meant hopping between them, with no link between a drop in logs and the disconnection that caused it.

Process

I mapped the troubleshooting journey with engineering and sales engineers, then prioritized every metric on the new dashboard against real customer interviews before it shipped.

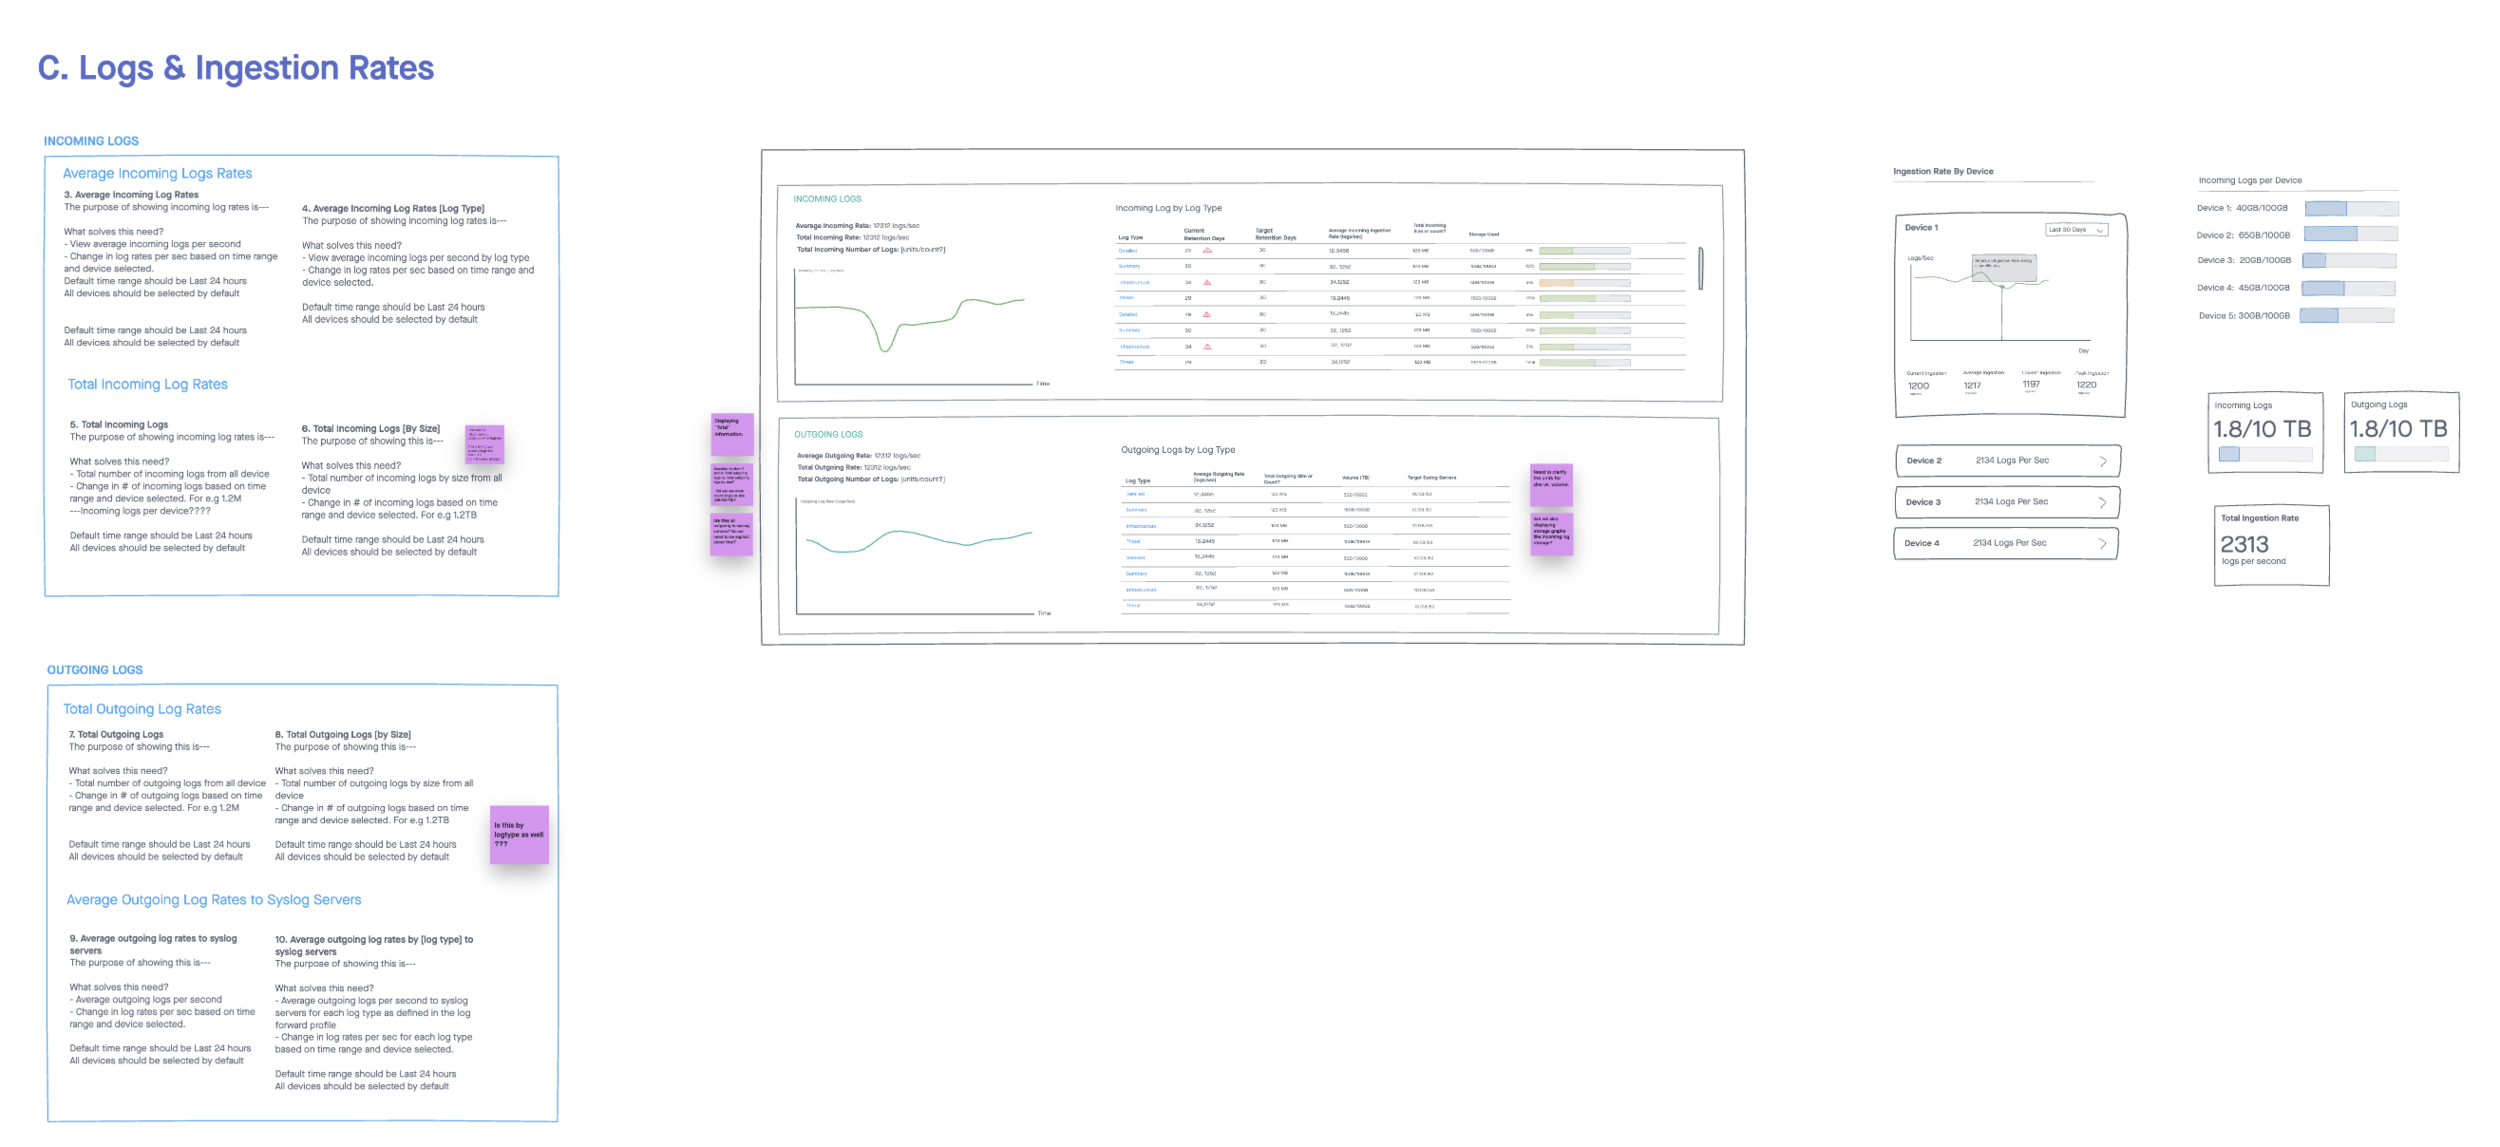
Each widget was written up before it was drawn: what it is for, what data answers that, and what should be true by default. Open questions stayed on the board as sticky notes rather than being settled quietly, which is what made the reviews with engineering worth having.

The page itself was drafted as three arrangements rather than one, so the discussion stayed on which layout served a troubleshooting job instead of on whether any single number deserved the space.
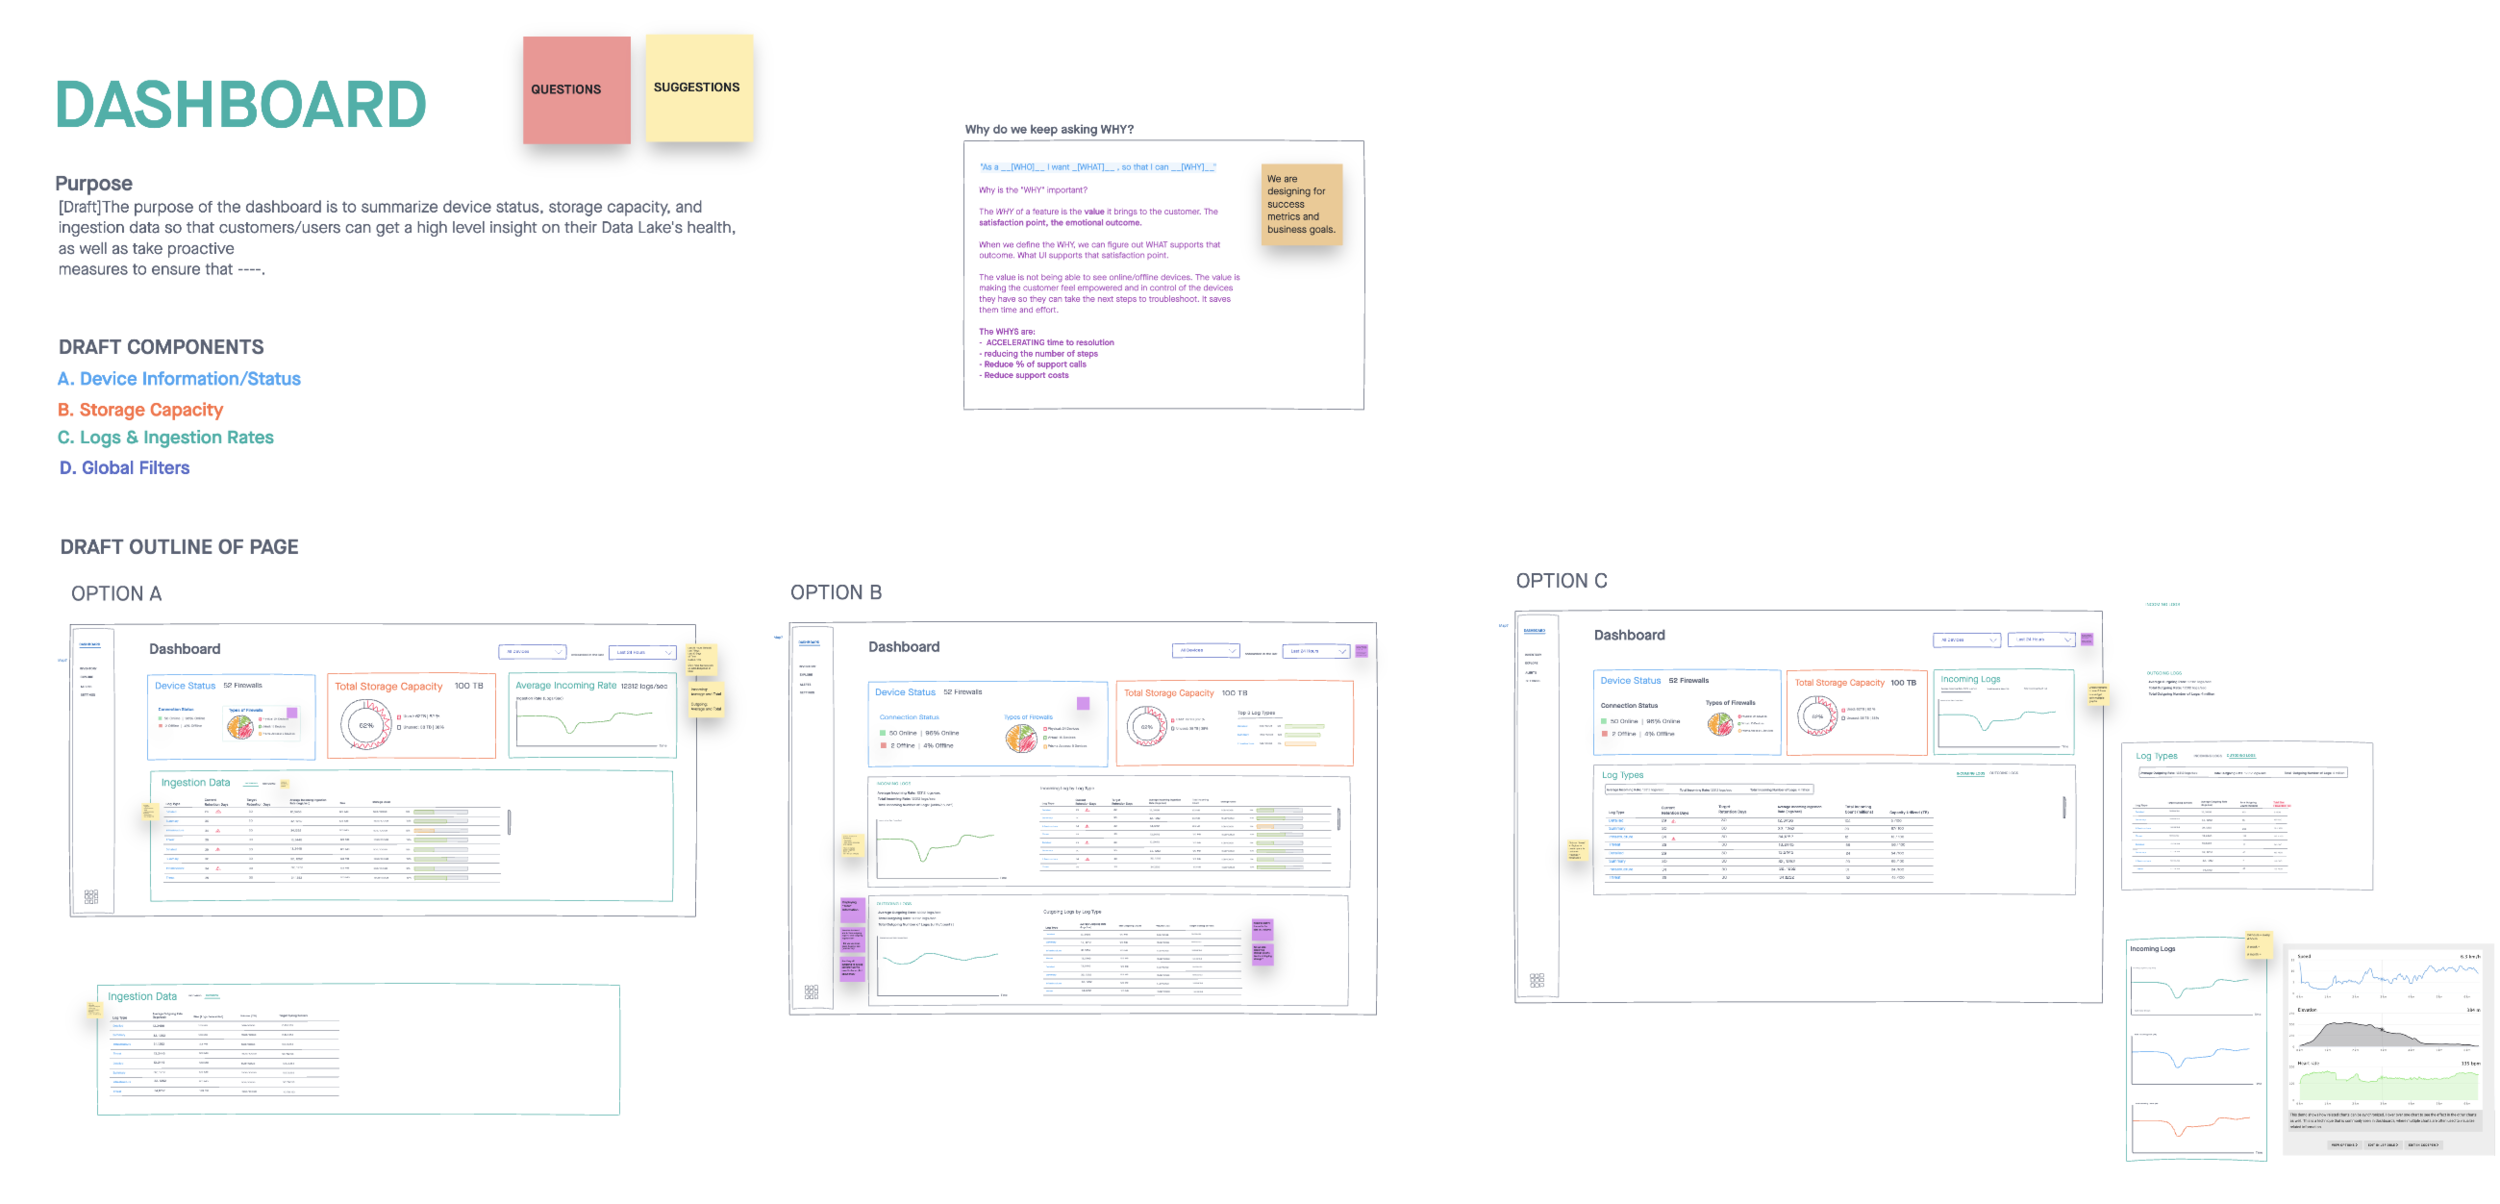
A requirements board headed Dashboard, stating its purpose and listing four draft components: device information and status, storage capacity, logs and ingestion rates, and global filters. A panel beside it argues why every feature needs a stated why. Below, three draft page layouts labelled Option A, Option B and Option C
The dashboard broken into four components, then drafted as three arrangements rather than one
A requirements board for the logs and ingestion component. Numbered widgets each state their purpose, the data that solves the need, and a default time range, alongside wireframes of incoming and outgoing log tables and per-device ingestion rates, annotated with open questions on sticky notes
One component specified widget by widget: the purpose, the data behind it, and the questions still open

Solution

Every firewall's health now lives on one screen, tied directly to the connection history behind it, with inventory and onboarding folded into the same app.
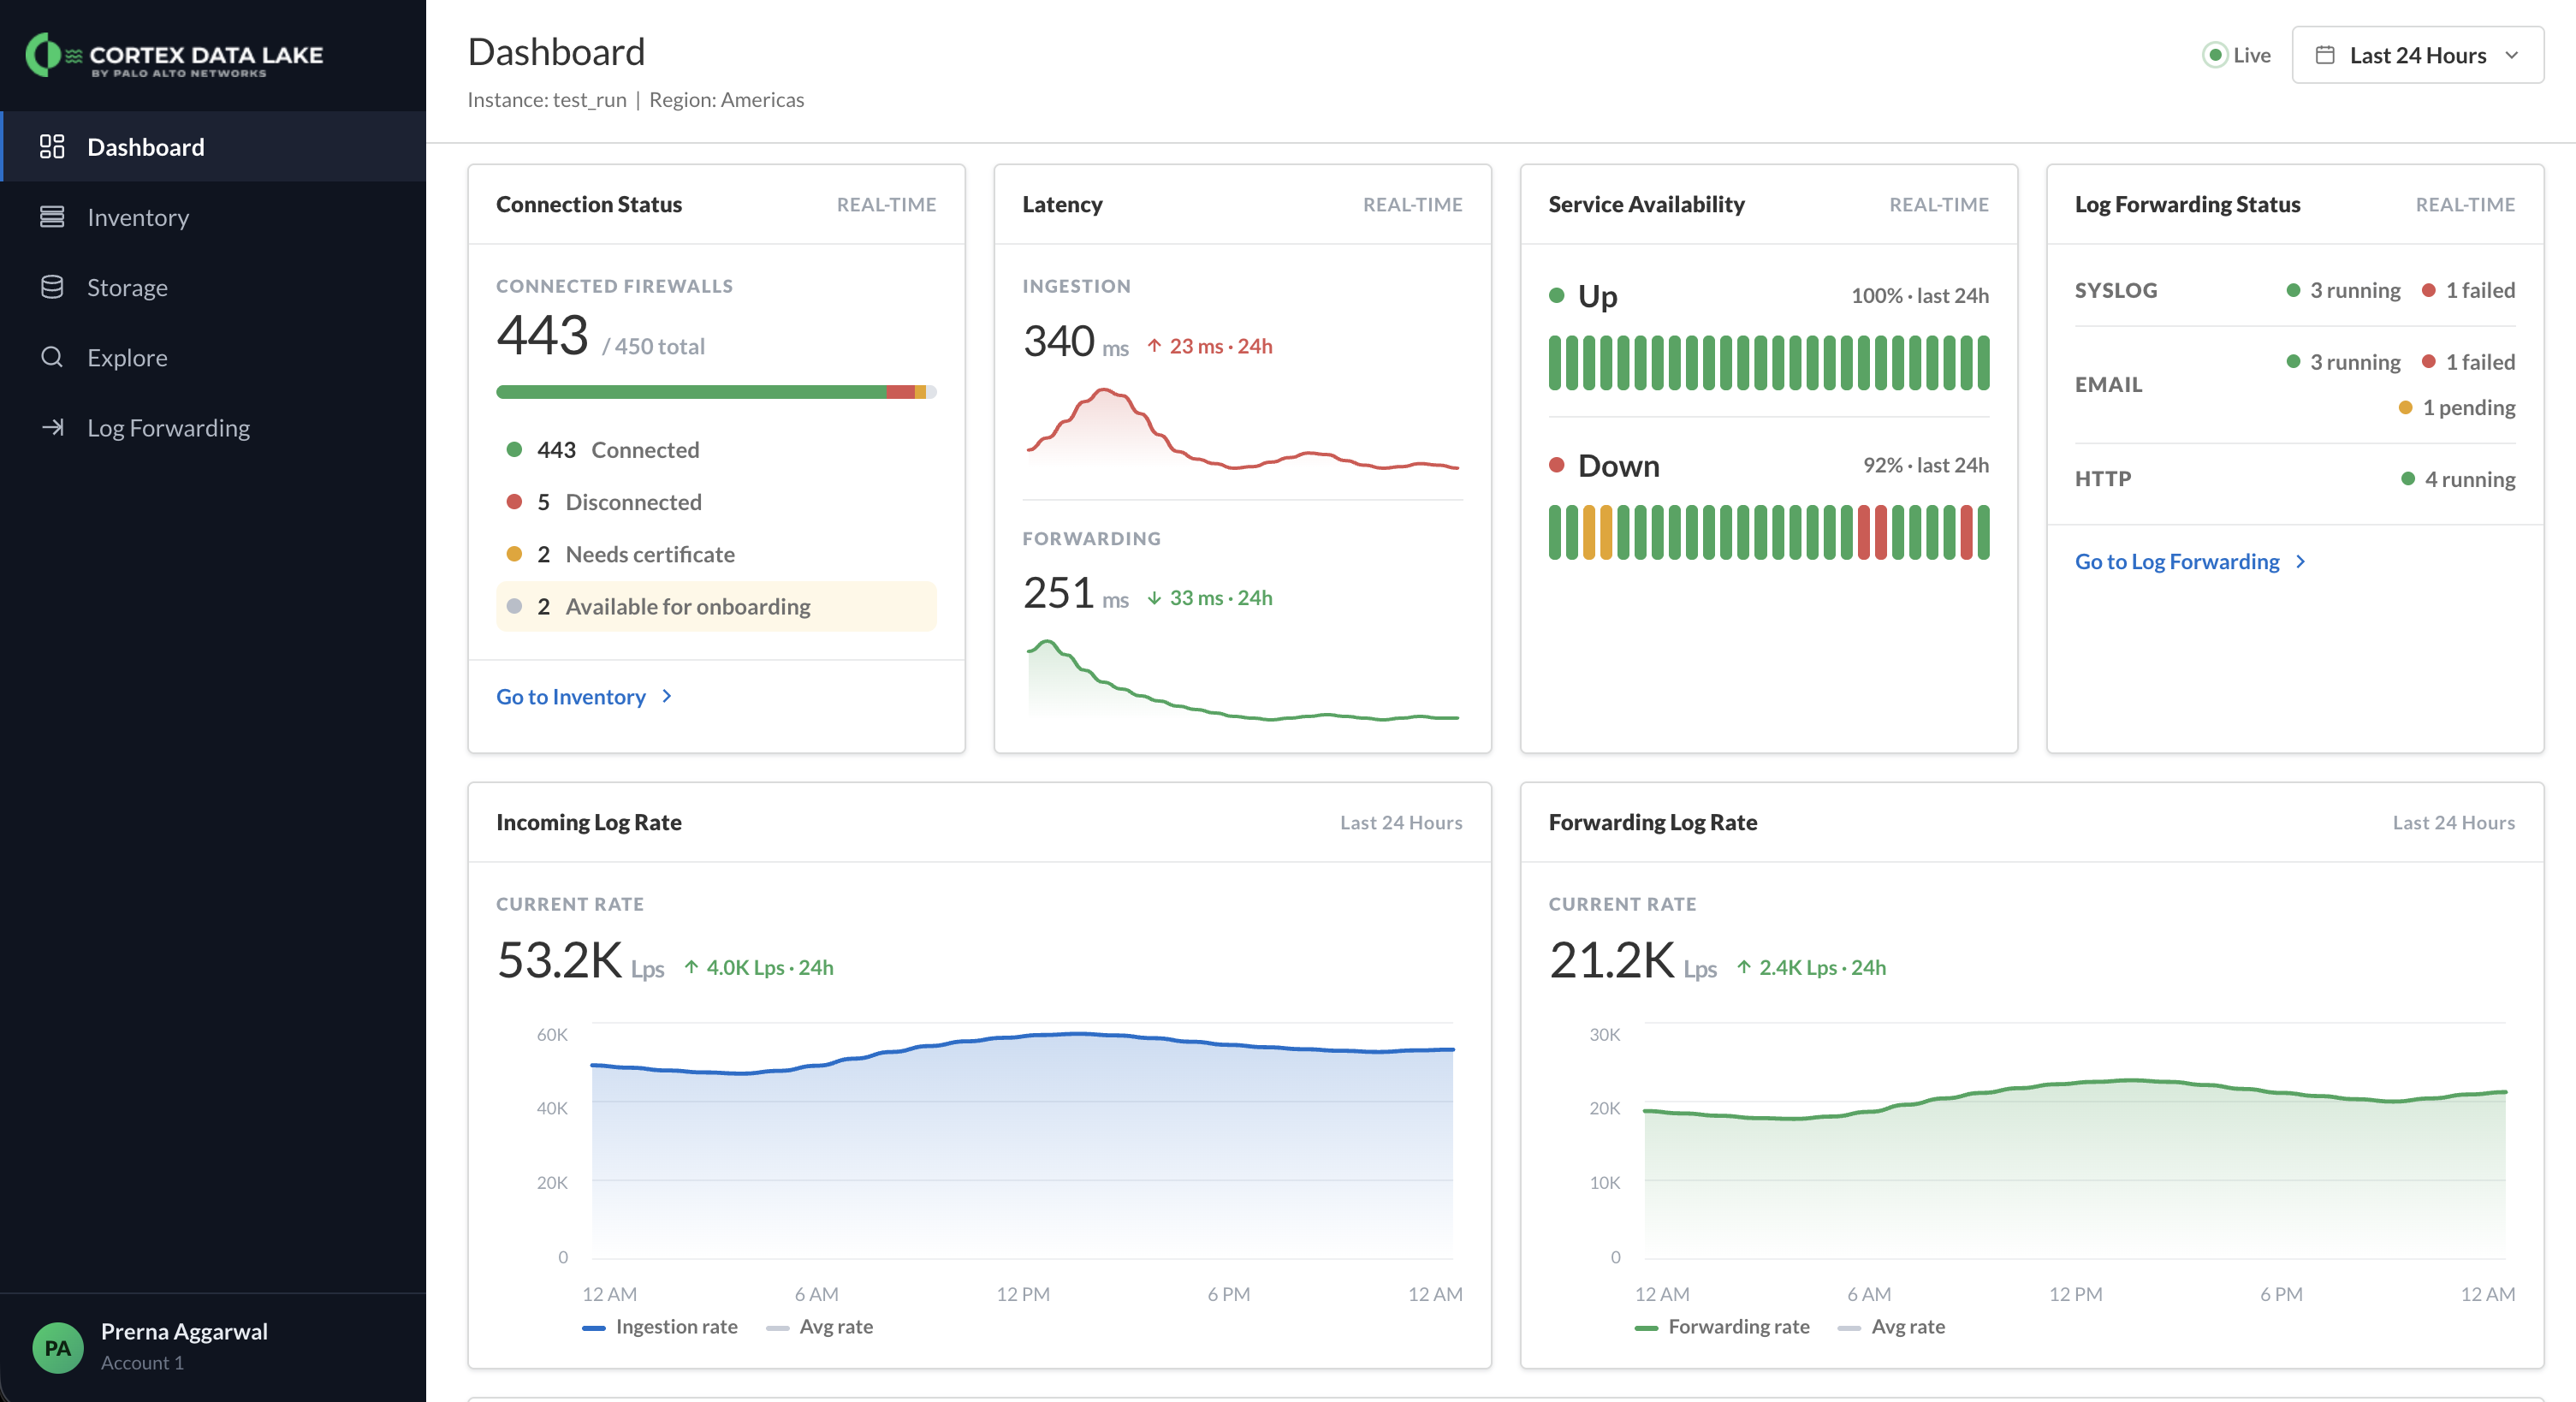
The redesigned Cortex Data Lake dashboard: connection status, latency, service availability, log forwarding, and incoming/forwarding log rates on one screen
A firewall's incoming-log chart with a connection-history timeline alongside it, tying a dip in logs to the disconnection that caused it
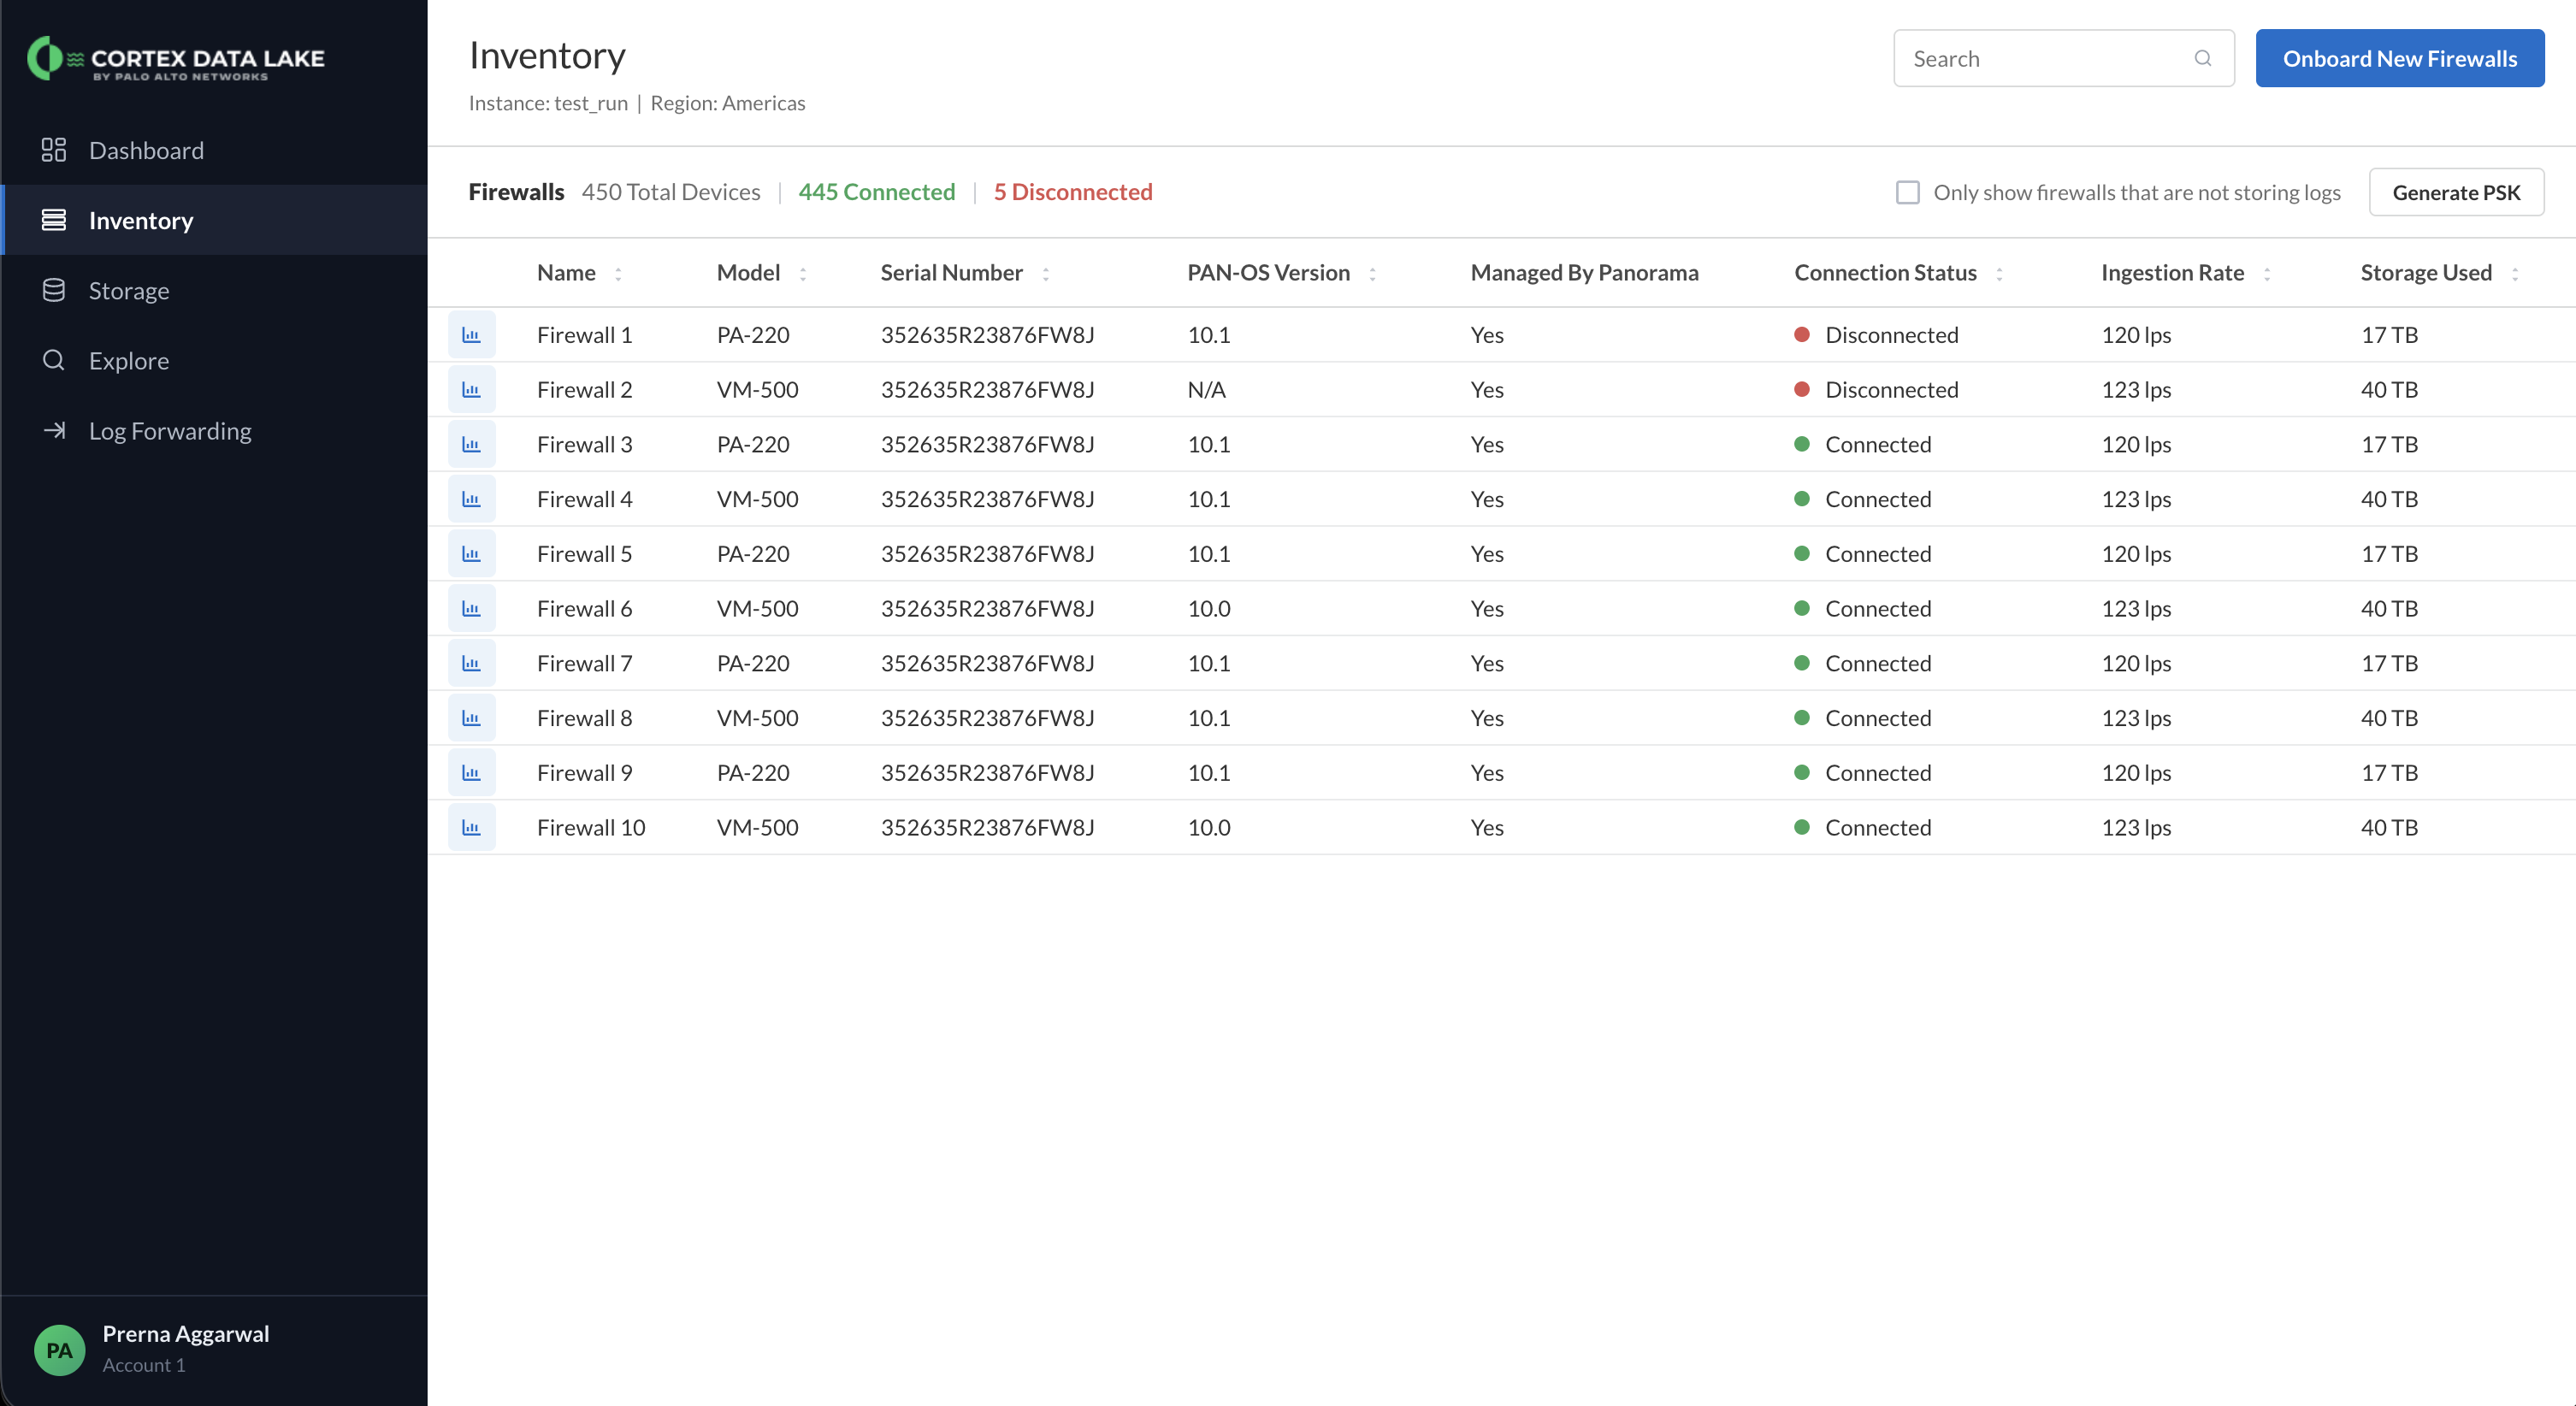
The Firewall Inventory table listing every device with model, serial number, connection status, ingestion rate, and storage used
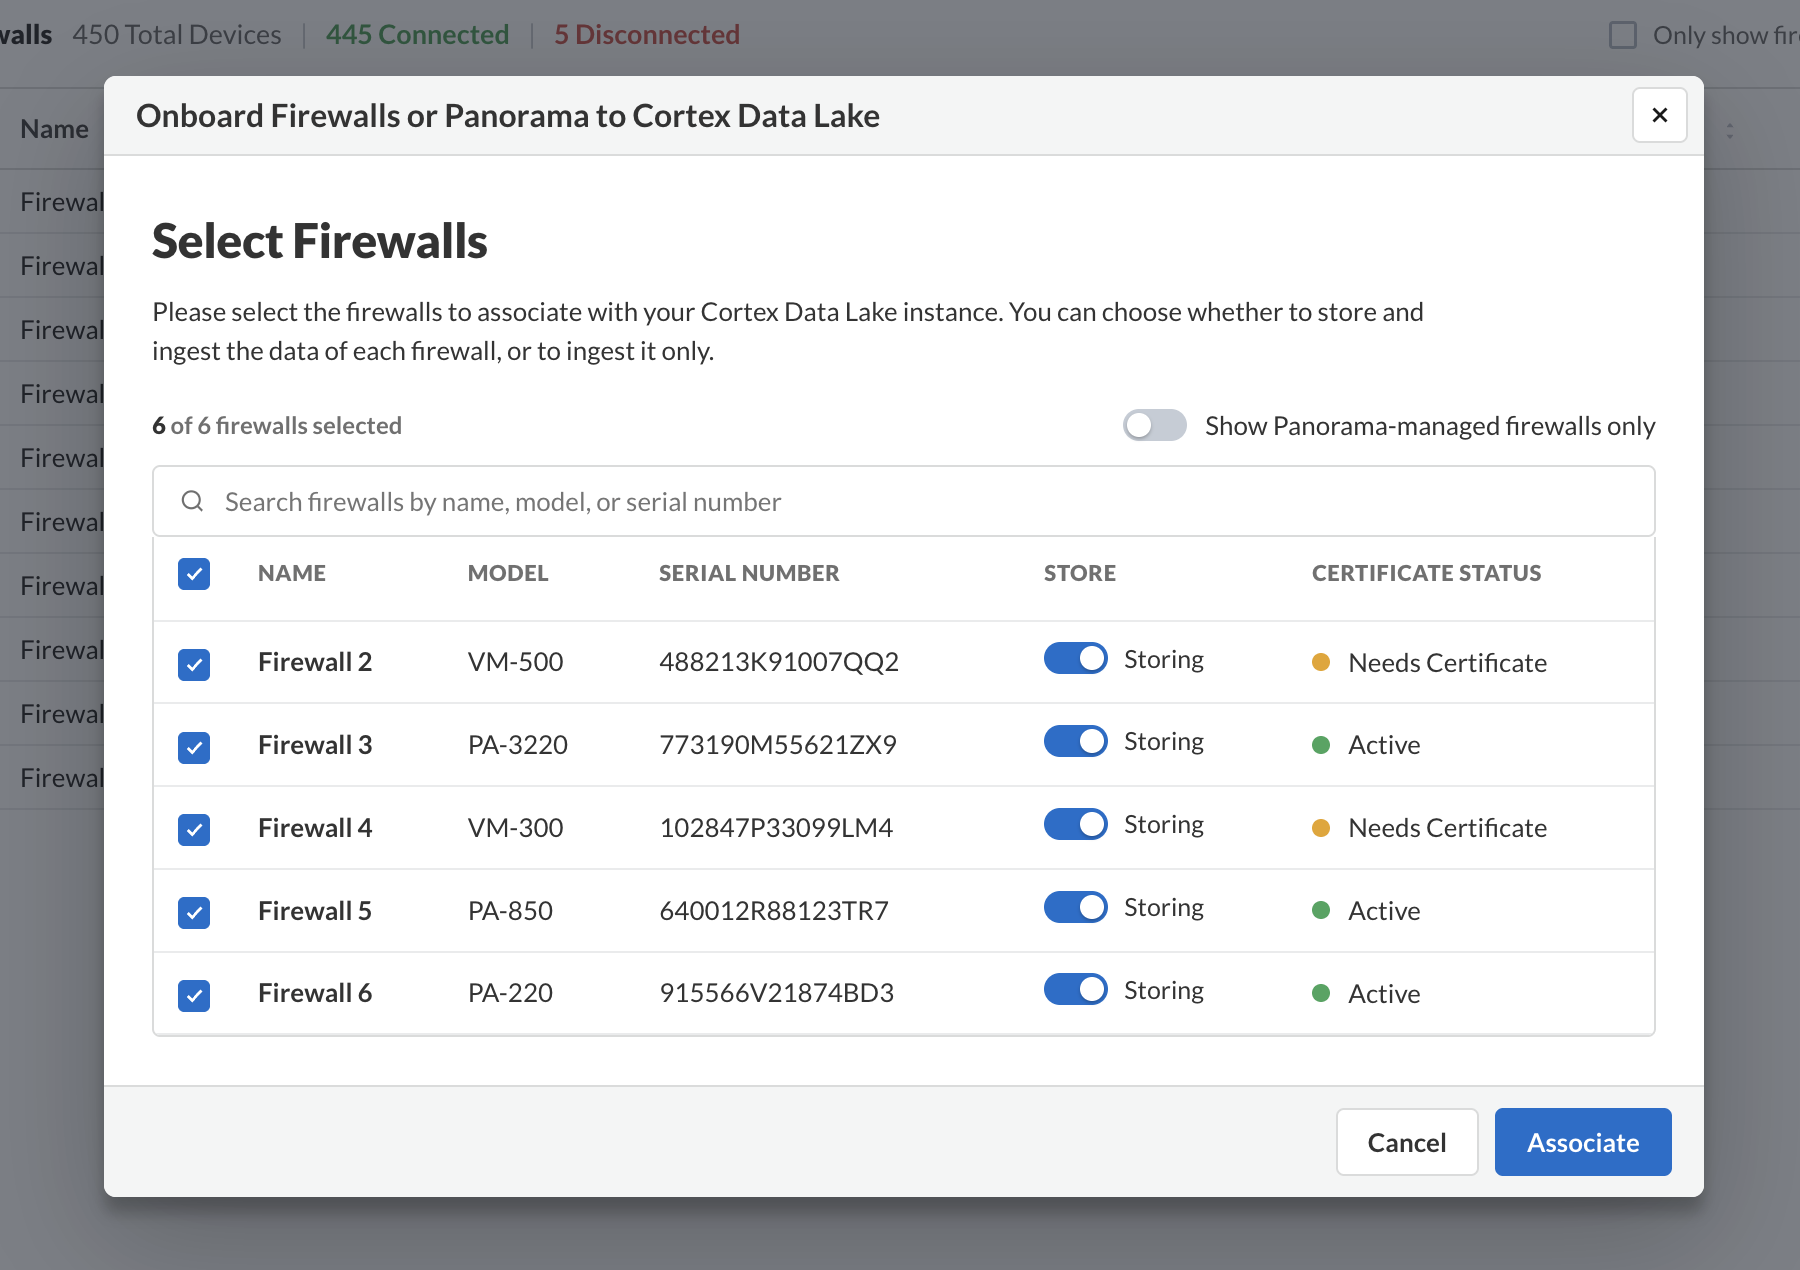
The onboarding dialog for adding new firewalls to Cortex Data Lake, with per-device store and certificate status

Outcome

3 → 1
Apps needed to troubleshoot
↓ Reduced
Support call volume
4.6 / 5
G2 rating

Next project

Rai: RAKBANK's AI assistant